Market Outlook
February 03, 2017
Market Cues
Domestic Indices
Chg (%)
(Pts)
(Close)
Indian markets are likely to start off on a soft note today taking a breather from the
BSE Sensex
0.3
85
28,227
two-day post-Budget rally.
Nifty
0.2
18
8,734
US markets showed a lack of direction throughout much of the trading session on
Mid Cap
0.9
120
13,205
Thursday after recovering from an early move to the downside. The major averages
Small Cap
1.0
125
13,279
spent the day bouncing back and forth across the unaffected lines.
Bankex
0.3
73
23,001
UK stocks closed up after the Bank of England left its interest rate unchanged and
announced no changes to its stimulus program. UK lawmakers gave a majority vote
Global Indices
Chg (%)
(Pts)
(Close)
allowing the prime minister to formally trigger Article 50 to seperate Britain from the
EU. Among the big movers, the consumer goods company Reckitt Benckiser Group
Dow Jones
(0.0)
(6)
19,885
rallied 4.08 percent on news that the company that it is in talks to buy baby food
Nasdaq
(0.1)
(6)
5,636
maker Mead Johnson Nutrition for $16.7bln. Vodafone closed down about 1
FTSE
0.5
33
7,141
percent on slower earnings growth due to intense competition in its Indian business.
Nikkei
(1.2)
(233)
18,915
After reacting strongly to the budget announcements, Indian markets consolidated
Hang Seng
(0.6)
(134)
23,185
on Thursday, however the bias remained positive and selective counters remained in
Shanghai Com
0.3
10
3,159
favor among investors. Bargain buying lifted some of the Pharma companies while
rally in selective banking stocks continued during the day as well.
Advances / Declines
BSE
NSE
News Analysis
Advances
1,570
912
Reliance Jio tariffs comply with regulations: Trai
Declines
1,260
735
Results Review: Equitas Holdings
Unchanged
125
65
Detailed analysis on Pg2
Investor’s Ready Reckoner
Volumes (` Cr)
Key Domestic & Global Indicators
BSE
3,836
NSE
26,833
Stock Watch: Latest investment recommendations on 150+ stocks
Refer Pg6 onwards
Net Inflows (` Cr)
Net
Mtd
Ytd
Top Picks
FII
75
75
28
CMP
Target
Upside
Company
Sector
Rating
(`)
(`)
(%)
MFs
(253)
5,215
5,215
Amara Raja Batteries Auto & Auto AncillaryAccumulate
909
1,009
11.0
Alkem Laboratories
Pharmaceuticals
Accumulate
1,771
1,989
12.3
Top Gainers
Price (`)
Chg (%)
HCL Tech
IT
Buy
826
1,000
21.1
Godrejind
482
10.5
Power Grid Corp.
Power
Accumulate
204
223
9.4
Repcohome
736
9.6
Navkar Corp.
Others
Buy
172
265
53.8
More Top Picks on Pg4
Corpbank
48
9.0
Muthootfin
346
7.1
Key Upcoming Events
Godrejprop
373
7.0
Previous
Consensus
Date
Region
Event Description
Reading
Expectations
Feb 03 US
Change in Nonfarm payrolls
156.0
175.0
Top Losers
Price (`)
Chg (%)
Feb 03 Germany PMI Services
53.2
53.2
Hcc
41
(4.9)
Feb 03 US
Unemployment rate
4. 7
4.7
Nationalum
73
(4.4)
Feb 08 India
RBI Cash Reserve Ratio
4.0
--
Unitech
5
(3.4)
Feb 08 India
RBI Reserve Repo rate
5.75
--
More Events on Pg5
Hindalco
193
(2.8)
Crisil
2,000
(2.7)
As on February 02, 2017
Market Outlook
February 03, 2017
News Analysis
Reliance Jio tariffs comply with regulations: Trai
Telecom Regulatory Authority of India (Trai) has stated that the tariff plans of
Reliance Jio are in compliance with its regulations and existing tariff orders. Trai is
expected to communicate the same to the other incumbent operators. Bharti Airtel
and Idea Cellular had moved Telecom Disputes Settlement and Appellate Tribunal
(TDSAT) against Trai for allowing Reliance Jio to continue free promotional offer
beyond the stipulated 90 days.
This decision comes a few days after the Attorney General communicated to the
Trai that Reliance Jio's tariff plans do not violate any existing regulation or order
issued by the regulator, and therefore intervention was not necessary.
Result Review
Equitas Holdings (CMP: `176 / TP: `235 / Upside: 33.5%)
Equitas Holdings came out with a good set of results for the quarter. NII grew by
48% YoY to `230.7cr vs `155.7cr , while PAT grew by 4% YoY to `44.9cr. The
lower than PAT growth vis a vis NII growth is due to higher provisions which the
company made as a prudent measures, looking at the stress level witnessed during
the quarter.
Business growth remained healthy during the quarter, which is evident from the
30% growth in consolidated AUM. While Micro Finance AUM growth witnessed
some moderation at 21%, the commercial vehicle finance grew by 33% and MSE
portfolio grew by a strong
61%, Housing Finance Business grew by
15%.
Disbursements during the quarter remained under pressure, down 24.45 QoQ at
`1,166cr, which was largely due to the cash crunch amid demonetization.
However, the management remains confident of it picking up in the quarters to
come.
The organization availed of the RBI’s dispensation of delayed recognition of NPAs
and hence the overall GNPAs remained under control at 2.46% vs 2.54% QoQ,
had it not availed of the same benefit the GNPAs would have gone up to 2.95%.
We believe Equitas’s performance is on track and is likely to improve in the
quarters to come. We maintain our positive stand on the stock and Maintain BUY
rating on the stock.
Economic and Political News
S&P says `10,000cr infusion into public sector banks is highly insufficient
Bonds worth `1.5-1.75lakh cr. to be issued under Uday in FY17.
Corporate News
Cyrus Mistry approaches the National Company Law Appellate Tribunal for an
injunction against Tata Sons proposed extra-ordinary general meeting
Tata Motors launches new sub-brand 'TAMO' to serve as incubating
environment for new technologies
HCC's Q3 net drops by 80.49% to `4.55cr
Market Outlook
February 03, 2017
Quarterly Bloomberg Brokers Consensus Estimate
ACC Ltd - Feb 3, 2017
Particulars ( ` cr)
4QCY16E
4QCY15
y-o-y (%)
3QCY16
q-o-q (%)
Net sales
2,654
2,846
(6.8)
2,471
7.4
EBITDA
343
282
21.7
273
25.4
EBITDA margin (%)
12.9
9.9
11.1
Net profit
167
103
62.4
84
98.0
Divi's Laboratories Ltd - Feb 4, 2017
Particulars ( ` cr)
3QFY17E
3QFY16
y-o-y (%)
2QFY17
q-o-q (%)
Net sales
1,123
852
31.8
1,003
12.0
EBITDA
378
322
17.4
291
30.0
EBITDA margin (%)
33.7
37.8
29.0
Net profit
299
247
21.3
224
33.7
Dr Reddy's Laboratories Ltd Consol - Feb 4, 2017
Particulars ( ` cr)
3QFY17E
3QFY16
y-o-y (%)
2QFY17
q-o-q (%)
Net sales
3,542
3,968
(10.7)
3,586
(1.2)
EBITDA
645
1,016
(36.5)
623
3.5
EBITDA margin (%)
18.2
25.6
17.4
Net profit
331
579
(42.9)
474
(30.2)
Bharat Heavy Electricals Ltd - Feb 7, 2017
Particulars ( ` cr)
3QFY17E
3QFY16
y-o-y (%)
2QFY17
q-o-q (%)
Net sales
6,514
5,230
24.5
6,551
(0.6)
EBITDA
78
(1,639)
0.0
155
(49.7)
EBITDA margin (%)
1.2
-31.3
2.4
Net profit
70
(1,102)
0.0
109
(35.8)
Titan Co Ltd - Feb 7, 2017
Particulars ( ` cr)
3QFY17E
3QFY16
y-o-y (%)
2QFY17
q-o-q (%)
Net sales
3,052
3,398
(10.2)
2,636
15.8
EBITDA
277
310
(10.7)
276
0.1
EBITDA margin (%)
9.1
9.1
10.5
Net profit
188
225
(16.4)
183
3.1
Market Outlook
February 03, 2017
Top Picks ★★★★★
Large Cap
Market Cap
CMP
Target
Upside
Company
Rationale
(` Cr)
(`)
(`)
(%)
To outpace battery industry growth due to better
Amara Raja Batteries
15,529
909
1,009
11.0
technological products leading to market share gains in both
the automotive OEM and replacement segments.
Strong growth in domestic business due to its leadership in
Alkem Laboratories
21,169
1,771
1,989
12.3
acute therapeutic segment. Alkem expects to launch more
products in USA, which bodes for its international business.
The stock is trading at attractive valuations and is factoring
HCL Tech
1,16,523
826
1,000
21.1
all the bad news.
Back on the growth trend, expect a long term growth of 14%
Infosys
2,14,845
935
1,249
33.5
to be a US$20bn in FY2020.
Strong order backlog and improvement in execution would
Larsen & Toubro
1,37,411
1,473
1,634
10.9
trigger the growth for the L&T
One of the largest pharma companies with strong
Lupin
66,969
1,484
1,809
21.9
international presence. It has a rich pipeline of ANDAs which
is also one of the largest among the generic companies.
Going forward, we expect the company to report strong top-
Power Grid Corporation
1,06,620
204
223
9.4
line CAGR of ~16% and bottom-line CAGR of ~19% over
FY16-18 on back of strong capitalization guidance
Source: Company, Angel Research
Mid Cap
Market Cap
CMP
Target
Upside
Company
Rationale
(` Cr)
(`)
(`)
(%)
We expect the company would report strong profitability
Asian Granito
815
271
351
29.5
owing to better product mix, higher B2C sales and
amalgamation synergy.
Among the top 4 players in the consumer durables segment.
Bajaj Electricals
2,480
245
274
11.7
Improved profitability backed by turn around in E&P segment.
Strong order book lends earnings visibility.
Favourable outlook for the AC industry to augur well for
Cooling products business which is out pacing the market
Blue Star
5,145
539
634
17.7
growth. EMPPAC division's profitability to improve once
operating environment turns around.
With a focus on the low and medium income (LMI) consumer
Dewan Housing Finance
9,234
295
350
18.7
segment, the company has increased its presence in tier-II &
III cities where the growth opportunity is immense.
Strong loan growth backed by diversified loan portfolio and
Equitas Holdings
5,918
176
235
33.2
adequate CAR. ROE & ROA likely to remain decent as risk of
dilution remains low. Attractive valuations considering growth.
Economic recovery to have favourable impact on advertising
& circulation revenue growth. Further, the acquisition of a
Jagran Prakashan
6,020
184
225
22.2
radio business (Radio City) would also boost the company's
revenue growth.
High order book execution in EPC segment, rising B2C sales
KEI Industries
1,113
143
153
7.0
and higher exports to boost the revenues and profitability
Speedier execution and speedier sales, strong revenue visibilty
Mahindra Lifespace
1,468
358
522
45.9
in short-to-long run, attractive valuations
Higher growth in domestic branded sales and healthy export
Mirza International
1,110
92
107
16.0
to boost the profitability.
Massive capacity expansion along with rail advantage at ICD
Navkar Corporation
2,458
172
265
53.8
as well CFS augurs well for the company
Strong brands and distribution network would boost growth
Siyaram Silk Mills
1,360
1,450
1,605
10.7
going ahead. Stock currently trades at an inexpensive
valuation.
Market leadership in Hindi news genre and no. 2 viewership
ranking in English news genre, exit from the radio business,
TV Today Network
1,598
268
385
43.7
and anticipated growth in ad spends by corporates to benefit
the stock.
Source: Company, Angel Research
Market Outlook
February 03, 2017
Key Upcoming Events
Result Calendar
Date
Company
February 03, 2017
ACC, J K Lakshmi Cements, PVR, MRF, Quick Heal, Manpasand Bever.
February 04, 2017
J & K Bank, Oriental Bank, Central Bank, Relaxo, Dr Reddy's, Divi's Lab.
February 06, 2017
Automotive Axle, LMW, GSPL, Abbott India, Banco
CEAT, BHEL, Ramco Cements, Punjab Natl.Bank, IDBI Bank, United Bank, Hexaware, Tata Steel, Godawari Ispat, L G
February 07, 2017
Balakrishnan & Bros, Orchid Chemicals, NHPC
Tata Chemicals, Hero Motocorp, Bharat Forge, Siemens, Thermax, Union Bank, Indraprasth Gas, Elecon Engineering,
February 08, 2017
Cipla, NTPC, Reliance Power, Competent Automobiles, Coffee Day Enterprises Ltd
Source: Bloomberg, Angel Research
Global economic events release calendar
Bloomberg Data
Date
Time
Country
Event Description
Unit
Period
Last Reported
Estimated
Feb 03, 2017
7:00 PM US
Change in Nonfarm payrolls
Thousands
Jan
156.00
175.00
2:25 PM Germany PMI Services
Value
Jan F
53.20
53.20
7:00 PM US
Unnemployment rate
%
Jan
4.70
4.70
Feb 08, 2017
2:30 PM India
RBI Cash Reserve ratio
%
Feb 8
4.00
2:30 PM India
RBI Reverse Repo rate
%
Feb 8
5.75
2:30 PM India
RBI Repo rate
%
Feb 8
6.25
Feb 10, 2017
India
Imports YoY%
% Change
Jan
0.50
India
Exports YoY%
% Change
Jan
5.70
China
Exports YoY%
% Change
Jan
(6.20)
4.00
3:00 PM UK
Industrial Production (YoY)
% Change
Dec
2.00
5:30 PM India
Industrial Production YoY
% Change
Dec
5.70
Feb 14, 2017
3:30 PM Euro Zone Euro-Zone GDP s.a. (QoQ)
% Change
4Q P
0.50
3:00 PM UK
CPI (YoY)
% Change
Jan
1.60
12:00 PM India
Monthly Wholesale Prices YoY%
% Change
Jan
3.39
US
Producer Price Index (mom)
% Change
Jan
0.80
Source: Bloomberg, Angel Research
Market Outlook
February 03, 2017
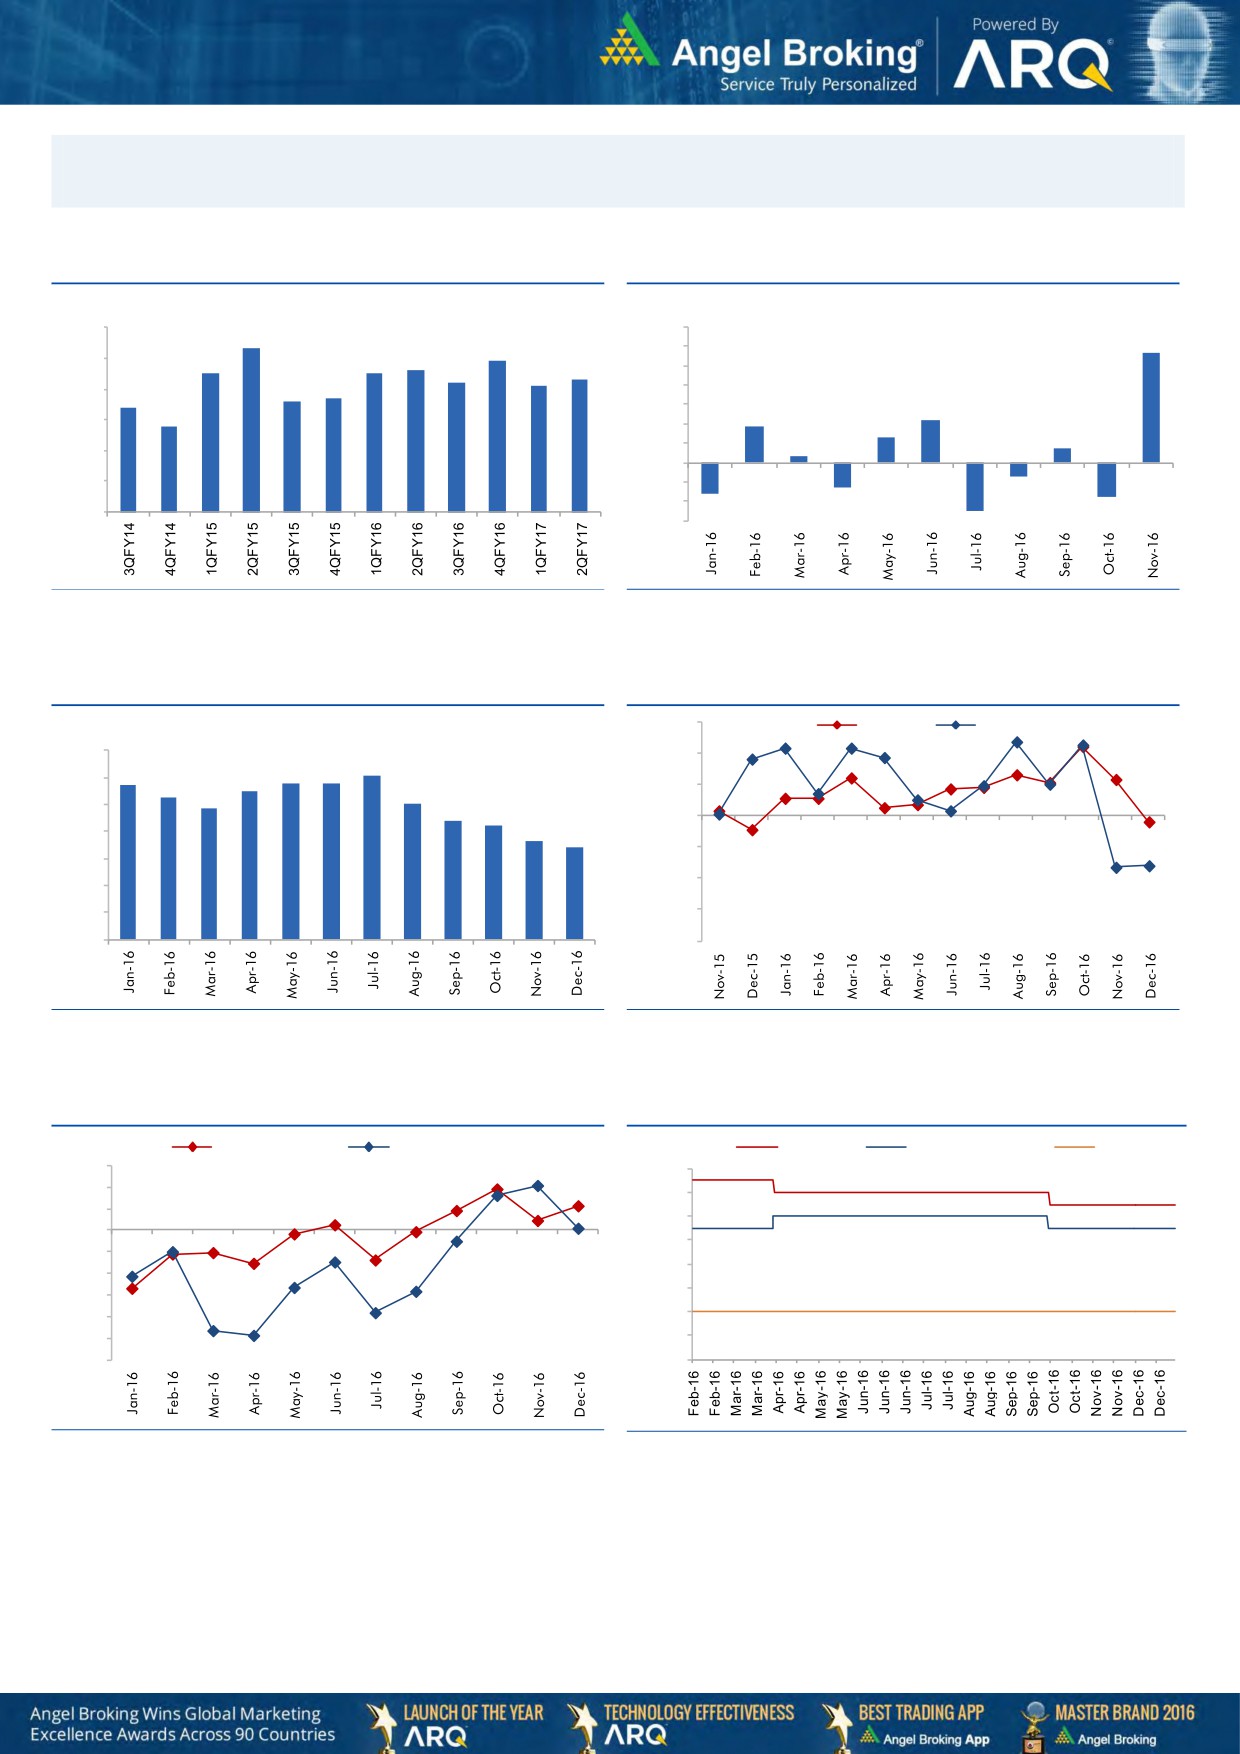
Macro watch
Exhibit 1: Quarterly GDP trends
Exhibit 2: IIP trends
(%)
(%)
9.0
8.3
7.0
5.7
7.9
6.0
8.0
7.5
7.5
7.6
7.3
5.0
7.2
7.1
6.6
6.7
4.0
7.0
6.4
3.0
2.2
5.8
1.9
6.0
2.0
1.3
0.7
1.0
0.3
5.0
-
4.0
(1.0)
(0.7)
(2.0)
(1.3)
3.0
(1.6)
(1.8)
(3.0)
(2.5)
Source: CSO, Angel Research
Source: MOSPI, Angel Research
Exhibit 3: Monthly CPI inflation trends
Exhibit 4: Manufacturing and services PMI
56.0
Mfg. PMI
Services PMI
(%)
7.0
54.0
6.1
5.7
5.8
5.8
6.0
5.3
5.5
5.1
52.0
4.8
5.0
4.4
4.2
50.0
4.0
3.6
3.4
48.0
3.0
46.0
2.0
1.0
44.0
-
42.0
Source: MOSPI, Angel Research
Source: Market, Angel Research; Note: Level above 50 indicates expansion
Exhibit 5: Exports and imports growth trends
Exhibit 6: Key policy rates
(%)
Exports yoy growth
Imports yoy growth
(%)
Repo rate
Reverse Repo rate
CRR
15.0
7.00
10.0
6.50
5.0
6.00
0.0
5.50
(5.0)
5.00
(10.0)
4.50
(15.0)
(20.0)
4.00
(25.0)
3.50
(30.0)
3.00
Source: Bloomberg, Angel Research
Source: RBI, Angel Research
Market Outlook
February 03, 2017
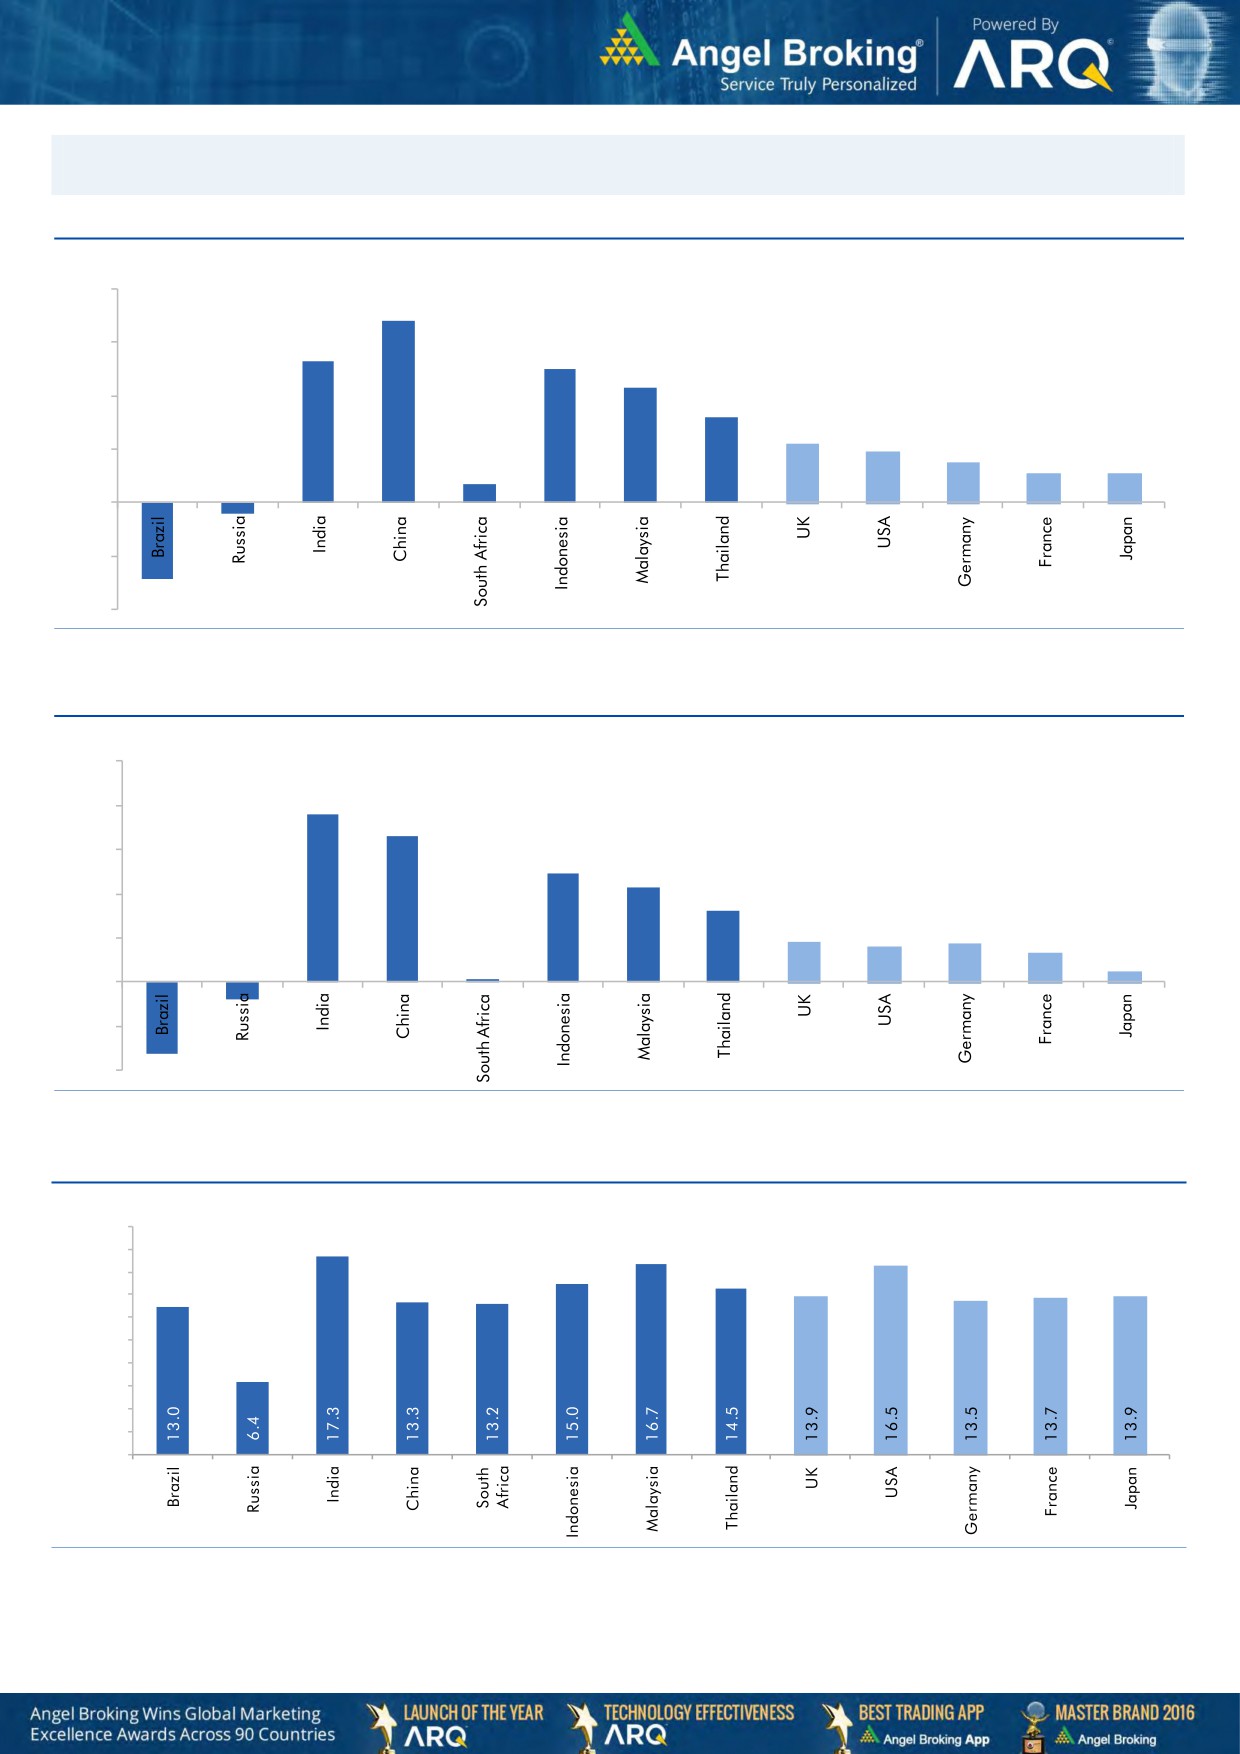
Global watch
Exhibit 1: Latest quarterly GDP Growth (%, yoy) across select developing and developed countries
(%)
8.0
6.8
5.3
6.0
5.0
0.7
4.3
4.0
3.2
2.2
1.9
1.5
2.0
1.1
1.1
-
(2.0)
(0.4)
(2.9)
(4.0)
Source: Bloomberg, Angel Research
Exhibit 2: 2016 GDP Growth projection by IMF (%, yoy) across select developing and developed countries
(%)
10.0
7.6
8.0
6.6
6.0
4.9
4.3
4.0
3.2
1.8
1.7
1.6
2.0
1.3
(0.8)
0.5
(3.3)
0.1
-
(2.0)
(4.0)
Source: IMF, Angel Research
Exhibit 3: One year forward P-E ratio across select developing and developed countries
(x)
20.0
18.0
16.0
14.0
12.0
10.0
8.0
6.0
4.0
2.0
-
Source: IMF, Angel Research
Market Outlook
February 03, 2017
Exhibit 4: Relative performance of indices across globe
Returns (%)
Country
Name of index
Closing price
1M
3M
1YR
Brazil
Bovespa
64,578
8.4
(0.5)
67.3
Russia
Micex
2,218
(3.0)
12.6
24.5
India
Nifty
8,734
6.8
2.6
17.6
China
Shanghai Composite
3,159
1.0
1.4
4.6
South Africa
Top 40
45,862
3.6
4.2
4.5
Mexico
Mexbol
47,095
2.1
(0.4)
10.1
Indonesia
LQ45
891
(0.1)
(3.6)
12.1
Malaysia
KLCI
1,686
4.1
0.7
5.3
Thailand
SET 50
982
1.8
4.9
23.8
USA
Dow Jones
19,885
0.6
9.6
21.1
UK
FTSE
7,141
1.6
3.3
18.6
Japan
Nikkei
18,915
0.2
13.3
14.2
Germany
DAX
11,628
0.4
12.6
29.0
France
CAC
4,794
(2.1)
8.7
20.0
Source: Bloomberg, Angel Research
Stock Watch
February 03, 2017
Company Name
Reco
CMP
Target
Mkt Cap
Sales ( Čcr )
OPM(%)
EPS (Č)
PER(x)
P/BV(x)
RoE(%)
EV/Sales(x)
(Č)
Price ( Č)
( Č cr )
FY17E FY18E
FY17E
FY18E
FY17E
FY18E
FY17E
FY18E
FY17E
FY18E
FY17E
FY18E
FY17E
FY18E
Agri / Agri Chemical
Rallis
Neutral
244
-
4,735
1,937
2,164
13.3
14.3
9.0
11.0
27.1
22.1
4.7
4.1
18.4
19.8
2.3
2.0
United Phosphorus
Neutral
739
-
37,484
15,176
17,604
18.5
18.5
37.4
44.6
19.8
16.6
3.9
3.2
21.4
21.2
2.6
2.2
Auto & Auto Ancillary
Ashok Leyland
Buy
95
111
27,007
22,407
26,022
10.6
10.6
5.2
6.4
18.2
14.8
4.1
3.5
23.6
24.7
1.2
1.0
Bajaj Auto
Neutral
2,809
-
81,277
25,093
27,891
19.5
19.2
143.9
162.5
19.5
17.3
5.5
4.7
30.3
29.4
3.0
2.6
Bharat Forge
Neutral
967
-
22,502
7,726
8,713
20.5
21.2
35.3
42.7
27.4
22.6
5.1
4.6
18.9
20.1
2.9
2.6
Eicher Motors
Neutral
23,779
-
64,688
16,583
20,447
17.5
18.0
598.0
745.2
39.8
31.9
13.6
10.4
41.2
38.3
3.6
2.9
Gabriel India
Buy
112
130
1,613
1,544
1,715
9.0
9.3
5.4
6.3
20.8
17.8
3.9
3.5
18.9
19.5
1.0
0.9
Hero Motocorp
Accumulate
3,226
3,541
64,420
30,958
34,139
15.7
15.7
193.6
208.3
16.7
15.5
6.5
5.4
34.2
30.5
1.9
1.7
Jamna Auto Industries Neutral
192
-
1,532
1,486
1,620
9.8
9.9
15.0
17.2
12.8
11.2
2.8
2.4
21.8
21.3
1.1
1.0
L G Balakrishnan & Bros Neutral
599
-
940
1,302
1,432
11.6
11.9
43.7
53.0
13.7
11.3
1.9
1.8
13.8
14.2
0.8
0.7
Mahindra and Mahindra Neutral
1,265
-
78,540
46,534
53,077
11.6
11.7
67.3
78.1
18.8
16.2
3.1
2.7
15.4
15.8
1.6
1.4
Maruti
Accumulate
6,145
6,560
185,624
67,822
83,288
16.0
16.4
253.8
312.4
24.2
19.7
5.6
4.5
23.0
22.9
2.2
1.8
Minda Industries
Neutral
371
-
2,942
2,728
3,042
9.0
9.1
68.2
86.2
5.4
4.3
1.2
1.0
23.8
24.3
1.1
0.9
Motherson Sumi
Neutral
336
-
47,140
45,896
53,687
7.8
8.3
13.0
16.1
25.8
20.9
8.3
6.6
34.7
35.4
1.1
0.9
Rane Brake Lining
Neutral
973
-
770
511
562
11.3
11.5
28.1
30.9
34.6
31.5
5.3
4.8
15.3
15.0
1.7
1.5
Setco Automotive
Neutral
37
-
494
741
837
13.0
13.0
15.2
17.0
2.4
2.2
0.4
0.4
15.8
16.3
1.1
1.0
Tata Motors
Neutral
531
-
153,267
300,209
338,549
8.9
8.4
42.7
54.3
12.4
9.8
2.0
1.7
15.6
17.2
0.6
0.6
TVS Motor
Neutral
389
-
18,498
13,390
15,948
6.9
7.1
12.8
16.5
30.5
23.5
7.6
6.0
26.3
27.2
1.4
1.2
Amara Raja Batteries
Accumulate
909
1,009
15,529
5,305
6,100
16.0
16.3
28.4
34.0
32.0
26.7
6.2
5.2
19.3
19.3
2.9
2.5
Exide Industries
Neutral
210
-
17,820
7,439
8,307
15.0
15.0
8.1
9.3
25.9
22.5
3.6
3.2
14.3
16.7
1.8
1.6
Apollo Tyres
Buy
184
235
9,384
12,877
14,504
14.3
13.9
21.4
23.0
8.6
8.0
1.3
1.2
16.4
15.2
0.9
0.8
Ceat
Buy
1,189
1,450
4,809
7,524
8,624
13.0
12.7
131.1
144.3
9.1
8.2
1.7
1.4
19.8
18.6
0.7
0.6
JK Tyres
Neutral
120
-
2,730
7,455
8,056
15.0
15.0
21.8
24.5
5.5
4.9
1.2
0.9
22.8
21.3
0.5
0.4
Swaraj Engines
Neutral
1,444
-
1,793
660
810
15.2
16.4
54.5
72.8
26.5
19.8
8.3
7.5
31.5
39.2
2.5
2.0
Subros
Neutral
183
-
1,100
1,488
1,681
11.7
11.9
6.4
7.2
28.7
25.6
3.0
2.7
10.8
11.4
1.0
0.8
Indag Rubber
Neutral
181
-
475
286
326
19.8
16.8
11.7
13.3
15.5
13.6
2.6
2.4
17.8
17.1
1.3
1.2
Capital Goods
ACE
Neutral
49
-
482
709
814
4.1
4.6
1.4
2.1
34.8
23.2
1.4
1.4
4.4
6.0
0.8
0.7
BEML
Neutral
1,217
-
5,069
3,451
4,055
6.3
9.2
31.4
57.9
38.8
21.0
2.3
2.1
6.3
10.9
1.6
1.4
Bharat Electronics
Neutral
1,546
-
34,525
8,137
9,169
16.8
17.2
58.7
62.5
26.3
24.7
4.1
3.6
44.6
46.3
3.1
2.8
Stock Watch
February 03, 2017
Company Name
Reco
CMP
Target
Mkt Cap
Sales ( Čcr )
OPM(%)
EPS (Č)
PER(x)
P/BV(x)
RoE(%)
EV/Sales(x)
(Č)
Price ( Č)
( Č cr )
FY17E
FY18E
FY17E
FY18E
FY17E
FY18E
FY17E
FY18E
FY17E
FY18E
FY17E
FY18E
FY17E
FY18E
Capital Goods
Voltas
Buy
331
407
10,962
6,511
7,514
7.9
8.7
12.9
16.3
25.7
20.3
4.6
4.1
16.7
18.5
1.4
1.2
BGR Energy
Neutral
133
-
959
16,567
33,848
6.0
5.6
7.8
5.9
17.0
22.5
1.0
0.9
4.7
4.2
0.2
0.1
BHEL
Neutral
139
-
34,009
28,797
34,742
-
2.8
2.3
6.9
60.4
20.1
1.0
1.0
1.3
4.8
0.8
0.5
Blue Star
Buy
539
634
5,145
4,283
5,077
5.9
7.3
14.9
22.1
36.2
24.3
7.0
5.9
20.4
26.4
1.2
1.0
Crompton Greaves
Neutral
67
-
4,180
5,777
6,120
5.9
7.0
3.3
4.5
20.2
14.8
0.9
0.9
4.4
5.9
0.7
0.5
Greaves Cotton
Neutral
138
-
3,364
1,755
1,881
16.8
16.9
7.8
8.5
17.7
16.2
3.5
3.3
20.6
20.9
1.6
1.5
Inox Wind
Neutral
185
-
4,108
5,605
6,267
15.7
16.4
24.8
30.0
7.5
6.2
2.1
1.5
25.9
24.4
0.8
0.6
KEC International
Neutral
152
-
3,919
9,294
10,186
7.9
8.1
9.9
11.9
15.4
12.8
2.3
2.0
15.6
16.3
0.7
0.6
KEI Industries
Accumulate
144
153
1,116
2,574
2,921
10.4
10.0
10.1
11.8
14.2
12.1
2.5
2.1
17.7
17.4
0.6
0.6
Thermax
Neutral
809
-
9,643
5,421
5,940
7.3
7.3
25.7
30.2
31.5
26.8
3.8
3.5
12.2
13.1
1.7
1.5
VATech Wabag
Buy
481
681
2,622
3,136
3,845
8.9
9.1
26.0
35.9
18.5
13.4
2.3
2.0
13.4
15.9
0.8
0.6
Cement
ACC
Neutral
1,436
-
26,959
11,225
13,172
13.2
16.9
44.5
75.5
32.3
19.0
3.1
2.8
11.2
14.2
2.3
2.0
Ambuja Cements
Neutral
232
-
46,117
9,350
10,979
18.2
22.5
5.8
9.5
40.0
24.5
3.4
3.0
10.2
12.5
4.9
4.1
India Cements
Neutral
159
-
4,889
4,364
4,997
18.5
19.2
7.9
11.3
20.2
14.1
1.5
1.4
8.0
8.5
1.8
1.5
JK Cement
Neutral
767
-
5,360
4,398
5,173
15.5
17.5
31.2
55.5
24.6
13.8
3.0
2.6
12.0
15.5
1.7
1.4
J K Lakshmi Cement
Buy
393
565
4,621
2,913
3,412
14.5
19.5
7.5
22.5
52.4
17.5
3.2
2.7
12.5
18.0
2.0
1.7
Orient Cement
Buy
140
215
2,877
2,114
2,558
18.5
20.5
8.1
11.3
17.3
12.4
2.6
2.2
9.0
14.0
1.9
1.5
UltraTech Cement
Neutral
3,727
-
102,292
25,768
30,385
21.0
23.5
111.0
160.0
33.6
23.3
4.3
3.8
13.5
15.8
4.0
3.3
Construction
ITNL
Neutral
111
-
3,666
8,946
10,017
31.0
31.6
8.1
9.1
13.8
12.3
0.5
0.5
4.2
5.0
3.7
3.5
KNR Constructions
Neutral
187
-
2,630
1,385
1,673
14.7
14.0
41.2
48.5
4.5
3.9
0.9
0.7
14.9
15.2
2.0
1.6
Larsen & Toubro
Accumulate
1,473
1,634
137,411
111,017
124,908
11.0
11.0
61.1
66.7
24.1
22.1
2.9
2.7
13.1
12.9
2.3
2.1
Gujarat Pipavav Port
Neutral
144
-
6,959
705
788
52.2
51.7
5.0
5.6
28.8
25.7
2.8
2.6
11.2
11.2
9.2
7.8
Nagarjuna Const.
Neutral
84
-
4,675
8,842
9,775
9.1
8.8
5.3
6.4
15.9
13.1
1.3
1.2
8.2
9.1
0.7
0.6
PNC Infratech
Buy
106
143
2,706
2,350
2,904
13.1
13.2
9.0
8.8
11.7
12.0
0.4
0.4
15.9
13.9
1.3
1.0
Simplex Infra
Neutral
321
-
1,589
6,829
7,954
10.5
10.5
31.4
37.4
10.2
8.6
1.1
1.0
9.9
13.4
0.7
0.5
Power Mech Projects
Neutral
449
-
661
1,801
2,219
12.7
14.6
72.1
113.9
6.2
3.9
1.1
1.0
16.8
11.9
0.4
0.3
Sadbhav Engineering
Accumulate
284
298
4,878
3,598
4,140
10.3
10.6
9.0
11.9
31.6
23.9
3.3
2.9
9.9
11.9
1.6
1.4
NBCC
Neutral
275
-
16,512
7,428
9,549
7.9
8.6
8.2
11.0
33.6
25.0
1.7
1.3
28.2
28.7
1.9
1.4
MEP Infra
Neutral
41
-
663
1,877
1,943
30.6
29.8
3.0
4.2
13.6
9.7
6.6
4.4
0.6
0.6
1.7
1.6
Stock Watch
February 03, 2017
Company Name
Reco
CMP
Target
Mkt Cap
Sales ( Čcr )
OPM(%)
EPS (Č)
PER(x)
P/BV(x)
RoE(%)
EV/Sales(x)
(Č)
Price ( Č)
( Č cr )
FY17E
FY18E
FY17E
FY18E
FY17E
FY18E
FY17E
FY18E
FY17E
FY18E
FY17E
FY18E
FY17E
FY18E
Construction
SIPL
Neutral
101
-
3,557
1,036
1,252
65.5
66.2
(8.4)
(5.6)
3.8
4.3
(22.8)
(15.9)
11.7
9.7
Engineers India
Neutral
150
-
10,111
1,725
1,935
16.0
19.1
11.4
13.9
13.2
10.8
1.8
1.8
13.4
15.3
4.9
4.4
Financials
Axis Bank
Buy
482
580
115,377
46,932
53,575
3.5
3.4
32.4
44.6
14.9
10.8
1.9
1.7
13.6
16.5
-
-
Bank of Baroda
Neutral
178
-
40,933
19,980
23,178
1.8
1.8
11.5
17.3
15.5
10.3
1.8
1.5
8.3
10.1
-
-
Canara Bank
Neutral
299
-
16,211
15,225
16,836
1.8
1.8
14.5
28.0
20.6
10.7
1.4
1.2
5.8
8.5
-
-
Can Fin Homes
Buy
1,998
2,128
5,318
420
526
3.5
3.5
86.5
107.8
23.1
18.5
5.0
4.1
23.6
24.1
-
-
Cholamandalam Inv. &
#DIV/0!
1,044
16,315
2,012
2,317
6.3
6.3
42.7
53.6
24.5
19.5
3.9
3.3
16.9
18.3
-
-
Fin. Co.
Dewan Housing Finance Buy
295
350
9,234
2,225
2,688
2.9
2.9
29.7
34.6
9.9
8.5
1.6
1.4
16.1
16.8
-
-
Equitas Holdings
Buy
176
235
5,918
939
1,281
11.7
11.5
5.8
8.2
30.4
21.5
2.6
2.3
10.9
11.5
-
-
Federal Bank
Accumulate
84
85
14,436
8,259
8,995
3.0
3.0
4.3
5.6
19.5
15.0
1.7
1.5
8.5
10.1
-
-
HDFC
Neutral
1,403
-
222,314
11,475
13,450
3.4
3.4
45.3
52.5
31.0
26.7
6.0
5.3
20.2
20.5
-
-
HDFC Bank
Neutral
1,299
-
331,507
46,097
55,433
4.5
4.5
58.4
68.0
22.2
19.1
3.9
3.3
18.8
18.6
-
-
ICICI Bank
Buy
286
315
166,211
42,800
44,686
3.1
3.3
18.0
21.9
15.9
13.0
2.2
2.0
11.1
12.3
-
-
Lakshmi Vilas Bank
Buy
139
174
2,667
3,339
3,799
2.7
2.8
11.0
14.0
12.7
10.0
1.3
1.2
11.2
12.7
-
-
LIC Housing Finance
Buy
562
630
28,342
3,712
4,293
2.6
2.5
39.0
46.0
14.4
12.2
2.7
2.3
19.9
20.1
-
-
Punjab Natl.Bank
Neutral
143
-
30,334
23,532
23,595
2.3
2.4
6.8
12.6
21.0
11.3
3.2
2.3
3.3
6.5
-
-
RBL Bank
Neutral
394
-
14,587
1,783
2,309
2.6
2.6
12.7
16.4
31.1
24.1
3.4
3.0
12.8
13.3
-
-
South Ind.Bank
Neutral
22
-
2,954
6,435
7,578
2.5
2.5
2.7
3.1
8.1
7.1
1.0
0.9
10.1
11.2
-
-
St Bk of India
Neutral
273
-
217,437
88,650
98,335
2.6
2.6
13.5
18.8
20.2
14.5
1.9
1.7
7.0
8.5
-
-
Union Bank
Neutral
151
-
10,398
13,450
14,925
2.3
2.3
25.5
34.5
5.9
4.4
0.9
0.7
7.5
10.2
-
-
Yes Bank
Neutral
1,389
-
58,741
8,978
11,281
3.3
3.4
74.0
90.0
18.8
15.4
3.6
3.0
17.0
17.2
-
-
FMCG
Asian Paints
Neutral
989
-
94,874
17,128
18,978
16.8
16.4
19.1
20.7
51.8
47.8
18.0
17.0
34.8
35.5
5.4
4.9
Britannia
Buy
3,230
3,626
38,756
9,594
11,011
14.6
14.9
80.3
94.0
40.2
34.4
16.5
12.8
41.2
-
3.8
3.2
Colgate
Accumulate
901
995
24,517
4,605
5,149
23.4
23.4
23.8
26.9
37.9
33.5
21.0
16.4
64.8
66.8
5.2
4.7
Dabur India
Accumulate
274
304
48,230
8,315
9,405
19.8
20.7
8.1
9.2
33.8
29.8
9.4
7.8
31.6
31.0
5.6
5.0
GlaxoSmith Con*
Neutral
5,142
-
21,624
4,350
4,823
21.2
21.4
179.2
196.5
28.7
26.2
7.6
6.5
27.1
26.8
4.3
3.8
Godrej Consumer
Neutral
1,596
-
54,348
10,235
11,428
18.4
18.6
41.1
44.2
38.8
36.1
8.6
7.3
24.9
24.8
5.2
4.6
HUL
Neutral
845
-
182,860
35,252
38,495
17.8
17.8
20.7
22.4
40.9
37.7
39.1
33.5
95.6
88.9
5.2
4.7
ITC
Accumulate
274
284
331,762
40,059
44,439
38.3
39.2
9.0
10.1
30.5
27.0
8.5
7.4
27.8
27.5
7.5
6.8
Stock Watch
February 03, 2017
Company Name
Reco
CMP
Target
Mkt Cap
Sales ( Čcr )
OPM(%)
EPS (Č)
PER(x)
P/BV(x)
RoE(%)
EV/Sales(x)
(Č)
Price ( Č)
( Č cr )
FY17E FY18E
FY17E
FY18E
FY17E
FY18E
FY17E
FY18E
FY17E
FY18E
FY17E
FY18E
FY17E
FY18E
FMCG
Marico
Buy
255
300
32,943
6,430
7,349
18.8
19.5
6.4
7.7
39.9
33.2
12.0
10.1
33.2
32.5
4.9
4.3
Nestle*
Neutral
6,006
-
57,906
10,073
11,807
20.7
21.5
124.8
154.2
48.1
39.0
19.8
17.8
34.8
36.7
5.5
4.7
Tata Global
Neutral
138
-
8,688
8,675
9,088
9.8
9.8
7.4
8.2
18.6
16.8
2.1
2.0
7.9
8.1
0.9
0.8
Procter & Gamble
Accumulate
6,980
7,369
22,658
2,939
3,342
23.2
23.0
146.2
163.7
47.7
42.6
106.9
102.5
25.3
23.5
7.3
6.3
Hygiene
IT
HCL Tech^
Buy
826
1,000
116,523
49,242
57,168
20.5
20.5
55.7
64.1
14.8
12.9
3.0
2.3
20.3
17.9
2.3
1.8
Infosys
Buy
935
1,249
214,845
68,350
77,326
27.0
27.0
62.5
69.4
15.0
13.5
3.2
2.9
21.3
21.6
2.6
2.2
TCS
Accumulate
2,206
2,620
434,637
119,025
133,308
27.6
27.6
131.2
145.5
16.8
15.2
5.5
5.0
32.4
33.1
3.7
3.2
Tech Mahindra
Buy
462
600
44,915
29,673
32,937
15.5
17.0
32.8
39.9
14.1
11.6
2.8
2.4
19.6
20.7
1.3
1.1
Wipro
Buy
455
590
110,653
55,440
60,430
18.1
18.1
35.9
39.9
12.7
11.4
2.3
2.1
19.0
19.3
1.8
1.6
Media
D B Corp
Neutral
375
-
6,897
2,297
2,590
27.4
28.2
21.0
23.4
17.9
16.0
4.2
3.6
23.7
23.1
2.7
2.3
HT Media
Neutral
80
-
1,865
2,693
2,991
12.6
12.9
7.9
9.0
10.2
8.9
0.9
0.8
7.8
8.3
0.3
0.2
Jagran Prakashan
Buy
184
225
6,020
2,355
2,635
28.0
28.0
10.8
12.5
17.1
14.7
3.7
3.2
21.7
21.7
2.5
2.2
Sun TV Network
Neutral
552
-
21,748
2,850
3,265
70.1
71.0
26.2
30.4
21.1
18.2
5.4
4.8
24.3
25.6
7.0
6.0
Hindustan Media
Neutral
274
-
2,013
1,016
1,138
24.3
25.2
27.3
30.1
10.1
9.1
1.9
1.7
16.2
15.8
1.3
1.1
Ventures
TV Today Network
Buy
268
385
1,598
637
743
27.5
27.5
18.4
21.4
14.6
12.5
2.5
2.2
17.4
17.2
2.2
1.8
Metals & Mining
Coal India
Neutral
320
-
198,792
84,638
94,297
21.4
22.3
24.5
27.1
13.1
11.8
5.4
5.2
42.6
46.0
1.8
1.6
Hind. Zinc
Neutral
322
-
135,844
14,252
18,465
55.9
48.3
15.8
21.5
20.4
15.0
3.3
2.9
17.0
20.7
8.9
6.9
Hindalco
Neutral
193
-
39,949
107,899
112,095
7.4
8.2
9.2
13.0
21.0
14.9
1.0
1.0
4.8
6.6
0.9
0.8
JSW Steel
Neutral
194
-
46,834
53,201
58,779
16.1
16.2
130.6
153.7
1.5
1.3
0.2
0.2
14.0
14.4
1.6
1.4
NMDC
Neutral
148
-
46,889
6,643
7,284
44.4
47.7
7.1
7.7
20.9
19.3
1.8
1.8
8.8
9.2
4.7
4.2
SAIL
Neutral
66
-
27,321
47,528
53,738
(0.7)
2.1
(1.9)
2.6
25.4
0.7
0.7
(1.6)
3.9
1.4
1.3
Vedanta
Neutral
260
-
77,038
71,744
81,944
19.2
21.7
13.4
20.1
19.4
12.9
1.7
1.5
8.4
11.3
1.5
1.1
Tata Steel
Neutral
477
-
46,278
121,374
121,856
7.2
8.4
18.6
34.3
25.6
13.9
1.6
1.5
6.1
10.1
1.0
1.0
Oil & Gas
Cairn India
Neutral
284
-
53,199
9,127
10,632
4.3
20.6
8.8
11.7
32.2
24.2
1.0
1.0
3.3
4.2
7.2
6.0
GAIL
Neutral
477
-
60,500
56,220
65,198
9.3
10.1
27.1
33.3
17.6
14.3
1.6
1.5
9.3
10.7
1.3
1.1
ONGC
Neutral
201
-
257,820
137,222
152,563
15.0
21.8
19.5
24.1
10.3
8.3
0.9
0.8
8.5
10.1
2.2
2.0
Indian Oil Corp
Neutral
383
-
185,787
373,359
428,656
5.9
5.5
54.0
59.3
7.1
6.5
1.1
1.0
16.0
15.6
0.6
0.6
Reliance Industries
Neutral
1,045
-
338,874
301,963
358,039
12.1
12.6
87.7
101.7
11.9
10.3
1.2
1.1
10.7
11.3
1.6
1.3
Pharmaceuticals
Alembic Pharma
Neutral
555
-
10,457
3,483
4,083
20.2
21.4
24.3
30.4
22.8
18.3
5.2
4.2
25.5
25.3
3.1
2.6
Stock Watch
February 03, 2017
Company Name
Reco
CMP
Target
Mkt Cap
Sales ( Čcr )
OPM(%)
EPS (Č)
PER(x)
P/BV(x)
RoE(%)
EV/Sales(x)
(Č)
Price ( Č)
( Č cr )
FY17E
FY18E
FY17E
FY18E
FY17E
FY18E
FY17E
FY18E
FY17E
FY18E
FY17E
FY18E
FY17E
FY18E
Pharmaceuticals
Alkem Laboratories Ltd
Buy
1,771
1,989
21,169
6,043
6,893
18.7
19.3
80.5
88.8
22.0
19.9
4.9
4.1
22.3
20.3
3.2
2.8
Aurobindo Pharma
Buy
690
877
40,356
15,720
18,078
23.7
23.7
41.4
47.3
16.7
14.6
4.3
3.4
29.6
26.1
2.9
2.5
Aventis*
Neutral
4,080
-
9,396
2,277
2,597
17.3
18.3
149.4
172.0
27.3
23.7
4.5
3.7
25.1
28.8
3.9
3.2
Cadila Healthcare
Accumulate
364
400
37,280
10,429
12,318
22.6
22.0
16.9
19.2
21.6
19.0
5.5
4.4
28.5
25.7
3.5
2.9
Cipla
Sell
584
490
46,974
15,378
18,089
17.4
18.4
21.6
27.2
27.0
21.5
3.5
3.0
13.7
15.2
3.3
2.7
Dr Reddy's
Neutral
3,096
-
51,291
16,043
18,119
20.8
22.4
112.4
142.9
27.6
21.7
3.7
3.2
14.1
15.9
3.1
2.7
Dishman Pharma
Neutral
233
-
3,765
1,718
1,890
22.7
22.8
9.5
11.3
24.6
20.6
2.4
2.2
10.1
10.9
2.6
2.3
GSK Pharma*
Neutral
2,682
-
22,714
3,000
3,312
15.4
20.6
46.5
60.8
57.7
44.1
13.9
13.8
26.3
30.6
7.4
6.8
Indoco Remedies
Reduce
268
240
2,472
1,112
1,289
16.2
18.2
11.6
16.0
23.1
16.8
3.7
3.1
17.0
20.1
2.4
2.0
Ipca labs
Accumulate
532
613
6,715
3,303
3,799
15.3
15.3
17.3
19.7
30.8
27.0
2.7
2.5
9.1
9.4
2.2
1.9
Lupin
Buy
1,484
1,809
66,969
15,912
18,644
26.4
26.7
58.1
69.3
25.5
21.4
5.0
4.1
21.4
20.9
4.4
3.6
Sun Pharma
Buy
641
847
153,873
31,129
35,258
32.0
32.9
30.2
35.3
21.2
18.2
3.5
2.9
20.0
20.1
4.5
3.8
Power
Tata Power
Neutral
80
-
21,760
36,916
39,557
17.4
27.1
5.1
6.3
15.8
12.8
1.4
1.3
9.0
10.3
1.6
1.4
NTPC
Neutral
173
-
142,234
86,605
95,545
17.5
20.8
11.8
13.4
14.6
12.9
1.5
1.4
10.5
11.1
3.0
3.0
Power Grid
Accumulate
204
223
106,620
25,315
29,193
88.2
88.7
14.2
17.2
14.4
11.9
2.2
1.9
15.2
16.1
8.8
8.0
Real Estate
Prestige Estate
Buy
172
210
6,441
4,707
5,105
25.2
26.0
10.3
13.0
16.7
13.2
1.3
1.2
10.3
10.2
2.5
2.2
MLIFE
Buy
358
522
1,468
1,152
1,300
22.7
24.6
29.9
35.8
12.0
10.0
0.9
0.8
7.6
8.6
2.0
1.7
Telecom
Bharti Airtel
Neutral
354
-
141,308
105,086
114,808
34.5
34.7
12.2
16.4
29.0
21.6
2.0
1.8
6.8
8.4
2.1
1.8
Idea Cellular
Neutral
110
-
39,543
40,133
43,731
37.2
37.1
6.4
6.5
17.2
16.9
1.4
1.3
8.2
7.6
1.7
1.4
zOthers
Abbott India
Neutral
4,435
-
9,424
3,153
3,583
14.1
14.4
152.2
182.7
29.1
24.3
143.1
122.2
25.6
26.1
2.7
2.3
Asian Granito
Buy
271
351
815
1,071
1,182
12.1
12.4
12.7
16.0
21.3
17.0
2.0
1.8
9.5
10.7
1.1
0.9
Bajaj Electricals
Accumulate
245
274
2,480
4,801
5,351
5.7
6.2
10.4
13.7
23.5
17.9
2.9
2.6
12.4
14.5
0.5
0.4
Banco Products (India)
Neutral
213
-
1,523
1,353
1,471
12.3
12.4
14.5
16.3
14.7
13.1
20.3
18.3
14.5
14.6
1.0
111.7
Coffee Day Enterprises
Neutral
200
-
4,112
2,964
3,260
20.5
21.2
4.7
8.0
-
24.9
2.3
2.1
5.5
8.5
1.8
1.6
Ltd
Competent Automobiles Neutral
168
-
103
1,137
1,256
3.1
2.7
28.0
23.6
6.0
7.1
32.3
29.2
14.3
11.5
0.1
0.1
Elecon Engineering
Neutral
57
-
634
1,482
1,660
13.7
14.5
3.9
5.8
14.5
9.7
3.4
3.1
7.8
10.9
0.8
0.7
Finolex Cables
Neutral
444
-
6,784
2,883
3,115
12.0
12.1
14.2
18.6
31.2
23.9
16.6
14.5
15.8
14.6
2.0
1.8
Garware Wall Ropes
Neutral
596
-
1,304
873
938
14.3
14.3
35.2
37.5
17.0
15.9
3.0
2.5
17.5
15.9
1.5
1.4
Goodyear India*
Neutral
732
-
1,688
1,598
1,704
10.4
10.2
49.4
52.6
14.8
13.9
68.4
60.0
18.2
17.0
0.7
98.9
Stock Watch
February 03, 2017
Company Name
Reco
CMP
Target
Mkt Cap
Sales ( Čcr )
OPM(%)
EPS (Č)
PER(x)
P/BV(x)
RoE(%)
EV/Sales(x)
(Č)
Price ( Č)
( Č cr )
FY17E
FY18E
FY17E
FY18E
FY17E
FY18E
FY17E
FY18E
FY17E
FY18E
FY17E
FY18E
FY17E
FY18E
zOthers
Hitachi
Neutral
1,430
-
3,888
2,081
2,433
8.8
8.9
33.4
39.9
42.8
35.8
34.5
28.8
22.1
21.4
1.8
1.5
HSIL
Neutral
294
-
2,126
2,384
2,515
15.8
16.3
15.3
19.4
19.2
15.2
19.1
16.4
7.8
9.3
1.1
1.0
Interglobe Aviation
Neutral
856
-
30,929
21,122
26,005
14.5
27.6
110.7
132.1
7.7
6.5
46.3
33.0
168.5
201.1
1.6
1.2
Jyothy Laboratories
Neutral
347
-
6,308
1,440
2,052
11.5
13.0
8.5
10.0
40.9
34.7
9.9
9.2
18.6
19.3
4.8
3.3
Kirloskar Engines India
Neutral
340
-
4,917
2,554
2,800
9.9
10.0
10.5
12.1
32.4
28.1
13.6
12.8
10.7
11.7
1.5
1.3
Ltd
Linc Pen & Plastics
Neutral
272
-
403
382
420
9.3
9.5
13.5
15.7
20.2
17.3
3.5
3.0
17.1
17.3
1.2
1.0
M M Forgings
Neutral
497
-
600
546
608
20.4
20.7
41.3
48.7
12.1
10.2
68.1
60.3
16.6
17.0
0.9
0.8
Manpasand Bever.
Neutral
635
-
3,634
836
1,087
19.6
19.4
16.9
23.8
37.6
26.7
4.5
3.9
12.0
14.8
4.1
3.1
Mirza International
Buy
92
107
1,110
987
1,106
18.0
18.0
6.5
7.6
14.1
12.1
2.3
1.9
15.9
15.7
1.3
1.2
MT Educare
Neutral
127
-
506
366
417
17.7
18.2
9.4
10.8
13.6
11.8
3.0
2.6
22.2
22.3
1.4
1.2
Narayana Hrudaya
Neutral
335
-
6,838
1,873
2,166
11.5
11.7
2.6
4.0
126.5
84.4
7.8
7.0
6.1
8.3
3.8
3.3
Navkar Corporation
Buy
172
265
2,458
369
561
42.9
42.3
7.2
11.5
23.9
15.0
1.8
1.6
7.4
10.5
7.6
5.0
Navneet Education
Neutral
131
-
3,109
1,062
1,147
24.0
24.0
6.1
6.6
21.4
19.7
4.4
3.9
20.6
19.8
2.9
2.7
Nilkamal
Neutral
1,685
-
2,515
1,995
2,165
10.7
10.4
69.8
80.6
24.1
20.9
96.3
83.7
16.6
16.5
1.2
1.1
Page Industries
Neutral
14,266
-
15,912
2,450
3,124
20.1
17.6
299.0
310.0
47.7
46.0
317.7
242.5
47.1
87.5
6.6
5.2
Parag Milk Foods
Neutral
266
-
2,234
1,919
2,231
9.3
9.6
9.5
12.9
28.1
20.5
4.4
3.6
15.5
17.5
1.3
1.1
Quick Heal
Neutral
273
-
1,910
408
495
27.3
27.0
7.7
8.8
35.2
31.0
3.3
3.3
9.3
10.6
3.8
3.2
Radico Khaitan
Buy
125
147
1,663
1,667
1,824
13.0
13.2
6.7
8.2
18.8
15.3
1.7
1.6
9.0
10.2
1.3
1.2
Relaxo Footwears
Neutral
438
-
5,267
2,085
2,469
9.2
8.2
7.6
8.0
58.0
55.2
22.5
19.2
17.9
18.8
2.6
2.2
S H Kelkar & Co.
Neutral
313
-
4,527
1,036
1,160
15.1
15.0
6.1
7.2
51.3
43.6
5.5
5.0
10.7
11.5
4.2
3.7
Siyaram Silk Mills
Accumulate
1,450
1,605
1,360
1,733
1,948
11.6
11.7
96.6
114.7
15.0
12.7
2.3
2.0
15.3
15.7
1.0
0.9
Styrolution ABS India*
Neutral
621
-
1,092
1,440
1,537
9.2
9.0
40.6
42.6
15.3
14.6
39.0
35.5
12.3
11.6
0.7
0.6
Surya Roshni
Neutral
192
-
839
3,342
3,625
7.8
7.5
17.3
19.8
11.1
9.7
21.0
16.9
10.5
10.8
0.5
0.5
Team Lease Serv.
Neutral
974
-
1,665
3,229
4,001
1.5
1.8
22.8
32.8
42.8
29.7
4.6
4.0
10.7
13.4
0.4
0.3
The Byke Hospitality
Neutral
164
-
656
287
384
20.5
20.5
7.6
10.7
21.5
15.3
4.5
3.6
20.7
23.5
2.3
1.7
Transport Corporation of
Neutral
166
-
1,272
2,671
2,911
8.5
8.8
13.9
15.7
12.0
10.6
1.6
1.5
13.7
13.8
0.6
0.5
India
TVS Srichakra
Neutral
3,282
-
2,513
2,304
2,614
13.7
13.8
231.1
266.6
14.2
12.3
368.8
290.4
33.9
29.3
1.1
0.9
UFO Moviez
Neutral
437
-
1,205
619
685
33.2
33.4
30.0
34.9
14.6
12.5
2.0
1.7
13.8
13.9
1.7
1.3
Visaka Industries
Neutral
209
-
332
1,051
1,138
10.3
10.4
21.0
23.1
10.0
9.0
26.8
25.1
9.0
9.2
0.6
0.6
Stock Watch
February 03, 2017
Company Name
Reco
CMP
Target Mkt Cap
Sales ( Čcr )
OPM(%)
EPS (Č)
PER(x)
P/BV(x)
RoE(%)
EV/Sales(x)
(Č)
Price ( Č)
( Č cr )
FY17E FY18E FY17E FY18E FY17E FY18E FY17E FY18E FY17E FY18E FY17E FY18E FY17E FY18E
zOthers
VRL Logistics
Neutral
299
-
2,728
1,902
2,119
16.7
16.6
14.6
16.8
20.5
17.8
4.5
4.0
21.9
22.2
1.5
1.3
Wonderla Holidays
Neutral
370
-
2,088
287
355
38.0
40.0
11.3
14.2
32.7
26.0
4.7
4.1
21.4
23.9
7.0
5.7
Source: Company, Angel Research; Note: *December year end; #September year end; &October year end; Price as on February 02, 2017
Market Outlook
February 03, 2017
Research Team Tel: 022 - 39357800
DISCLAIMER
Angel Broking Private Limited (hereinafter referred to as “Angel”) is a registered Member of National Stock Exchange of India
Limited,Bombay Stock Exchange Limited and Metropolitan Stock Exchange Limited. It is also registered as a Depository Participant with
CDSL and Portfolio Manager with SEBI. It also has registration with AMFI as a Mutual Fund Distributor. Angel Broking Private Limited is a
registered entity with SEBI for Research Analyst in terms of SEBI (Research Analyst) Regulations, 2014 vide registration number
INH000000164. Angel or its associates has not been debarred/ suspended by SEBI or any other regulatory authority for accessing
/dealing in securities Market. Angel or its associates/analyst has not received any compensation / managed or
co-managed public offering of securities of the company covered by Analyst during the past twelve months.
This document is solely for the personal information of the recipient, and must not be singularly used as the basis of any investment
decision. Nothing in this document should be construed as investment or financial advice. Each recipient of this document should make
such investigations as they deem necessary to arrive at an independent evaluation of an investment in the securities of the companies
referred to in this document (including the merits and risks involved), and should consult their own advisors to determine the merits and
risks of such an investment.
Reports based on technical and derivative analysis center on studying charts of a stock's price movement, outstanding positions and
trading volume, as opposed to focusing on a company's fundamentals and, as such, may not match with a report on a company's
fundamentals. Investors are advised to refer the Fundamental and Technical Research Reports available on our website to evaluate the
contrary view, if any.
The information in this document has been printed on the basis of publicly available information, internal data and other reliable
sources believed to be true, but we do not represent that it is accurate or complete and it should not be relied on as such, as this
document is for general guidance only. Angel Broking Pvt. Limited or any of its affiliates/ group companies shall not be in any way
responsible for any loss or damage that may arise to any person from any inadvertent error in the information contained in this report.
Angel Broking Pvt. Limited has not independently verified all the information contained within this document. Accordingly, we cannot
testify, nor make any representation or warranty, express or implied, to the accuracy, contents or data contained within this document.
While Angel Broking Pvt. Limited endeavors to update on a reasonable basis the information discussed in this material, there may be
regulatory, compliance, or other reasons that prevent us from doing so.
This document is being supplied to you solely for your information, and its contents, information or data may not be reproduced,
redistributed or passed on, directly or indirectly.
Neither Angel Broking Pvt. Limited, nor its directors, employees or affiliates shall be liable for any loss or damage that may arise from
or in connection with the use of this information.